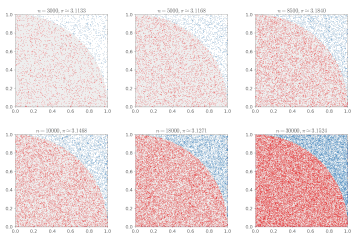
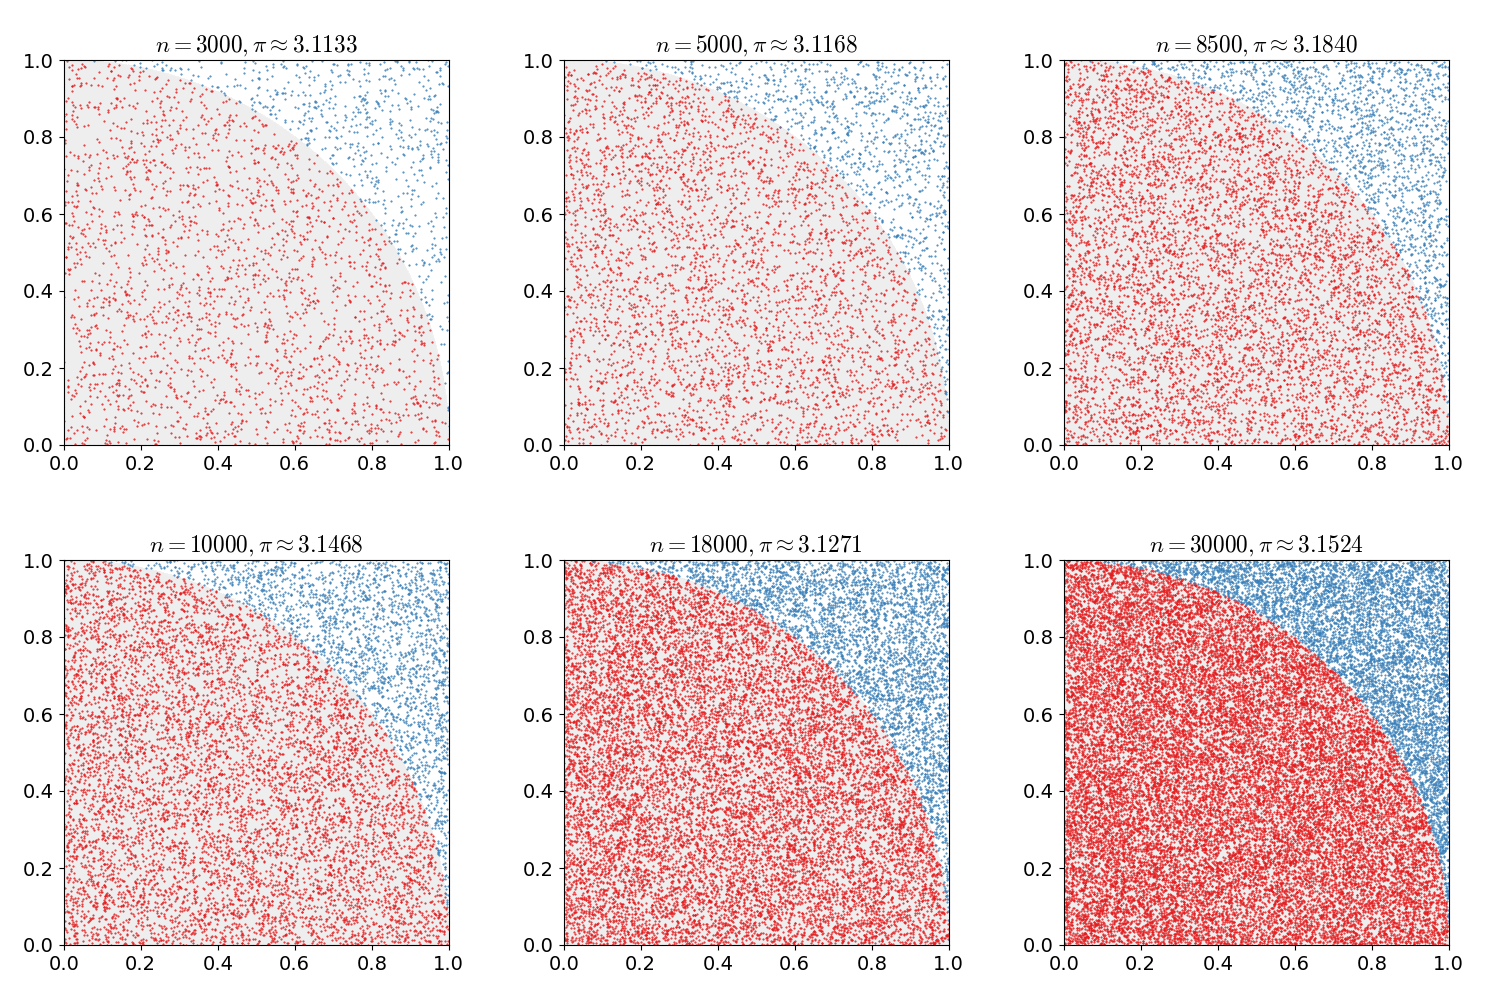
Datoteka:Pi 30K.gif
Pi_30K.gif (500 × 500 piksela, veličina datoteke: 476 KB, MIME tip: image/gif, stalno iznova, 10 sličica, 2,0 s)
Historija datoteke
Kliknite na datum/vrijeme da vidite verziju datoteke iz tog vremena.
| Datum/vrijeme | Smanjeni pregled | Dimenzije | Korisnik | Komentar | |
|---|---|---|---|---|---|
| trenutno | 18:00, 16 februar 2017 |  | 500 × 500 (476 KB) | Nicoguaro | Make the plot square and increase gif delay. |
| 17:38, 16 februar 2017 |  | 640 × 480 (476 KB) | Nicoguaro | Bigger text in the axes, and colors from ColorBrewer. Code in Python. | |
| 20:29, 7 novembar 2011 |  | 500 × 500 (373 KB) | Rayhem | Slowed animation to avoid looking like a blinky page element, improved resolution, added counter for number of points, shaded points inside/outside the circle. ==Mathematica 7.0 Source== <pre> tinyColor[color_, point_] := {PointSize[Small], color, Point[ | |
| 01:12, 15 mart 2011 |  | 360 × 369 (363 KB) | CaitlinJo | {{Information |Description ={{en|1=As points are randomly scattered inside the unit square, some fall within the unit circle. The fraction of points inside the circle over all points approaches pi as the number of points goes toward infinity. This ani |
Upotreba datoteke
Nema stranica koje koriste ovu datoteku.
Globalna upotreba datoteke
Sljedeći wikiji koriste ovu datoteku:
- Upotreba na ar.wikipedia.org
- Upotreba na be.wikipedia.org
- Upotreba na bg.wikipedia.org
- Upotreba na ca.wikipedia.org
- Upotreba na da.wikipedia.org
- Upotreba na el.wikipedia.org
- Upotreba na en.wikipedia.org
- Upotreba na en.wikibooks.org
- Upotreba na eo.wikipedia.org
- Upotreba na eu.wikipedia.org
- Upotreba na fa.wikipedia.org
- Upotreba na fr.wikipedia.org
- Upotreba na he.wikipedia.org
- Upotreba na hi.wikipedia.org
- Upotreba na id.wikipedia.org
- Upotreba na it.wikipedia.org
- Upotreba na ja.wikipedia.org
- Upotreba na ko.wikipedia.org
- Upotreba na pt.wikipedia.org
- Upotreba na sh.wikipedia.org
- Upotreba na simple.wikipedia.org
- Upotreba na sl.wikipedia.org
- Upotreba na sr.wikipedia.org
- Upotreba na sv.wikipedia.org
- Upotreba na ta.wikipedia.org
- Upotreba na test.wikipedia.org
- Upotreba na tr.wikipedia.org
- Upotreba na uk.wikipedia.org
- Upotreba na vi.wikipedia.org
- Upotreba na www.wikidata.org
- Upotreba na zh-yue.wikipedia.org
- Upotreba na zh.wikipedia.org
