Datoteka:Number of prokaryotic genomes and sequencing costs.svg

Veličina ovog PNG pregleda za ovu SVG datoteku: 800 × 533 piksela. Ostale rezolucije: 320 × 213 piksela | 640 × 427 piksela | 1.024 × 683 piksela | 1.280 × 853 piksela | 2.560 × 1.707 piksela | 1.350 × 900 piksela.
Izvorna datoteka (SVG datoteka, nominalno 1.350 × 900 piksela, veličina datoteke: 145 KB)
| Ova datoteka je s Wikimedia Commonsa. Opis s njene stranice opisa datoteke prikazan je ispod. Commons je skladište slobodnih medija i datoteka za sve projekte fondacije Wikimedia. Možete i Vi pomoći. |
Sažetak
| Opis |
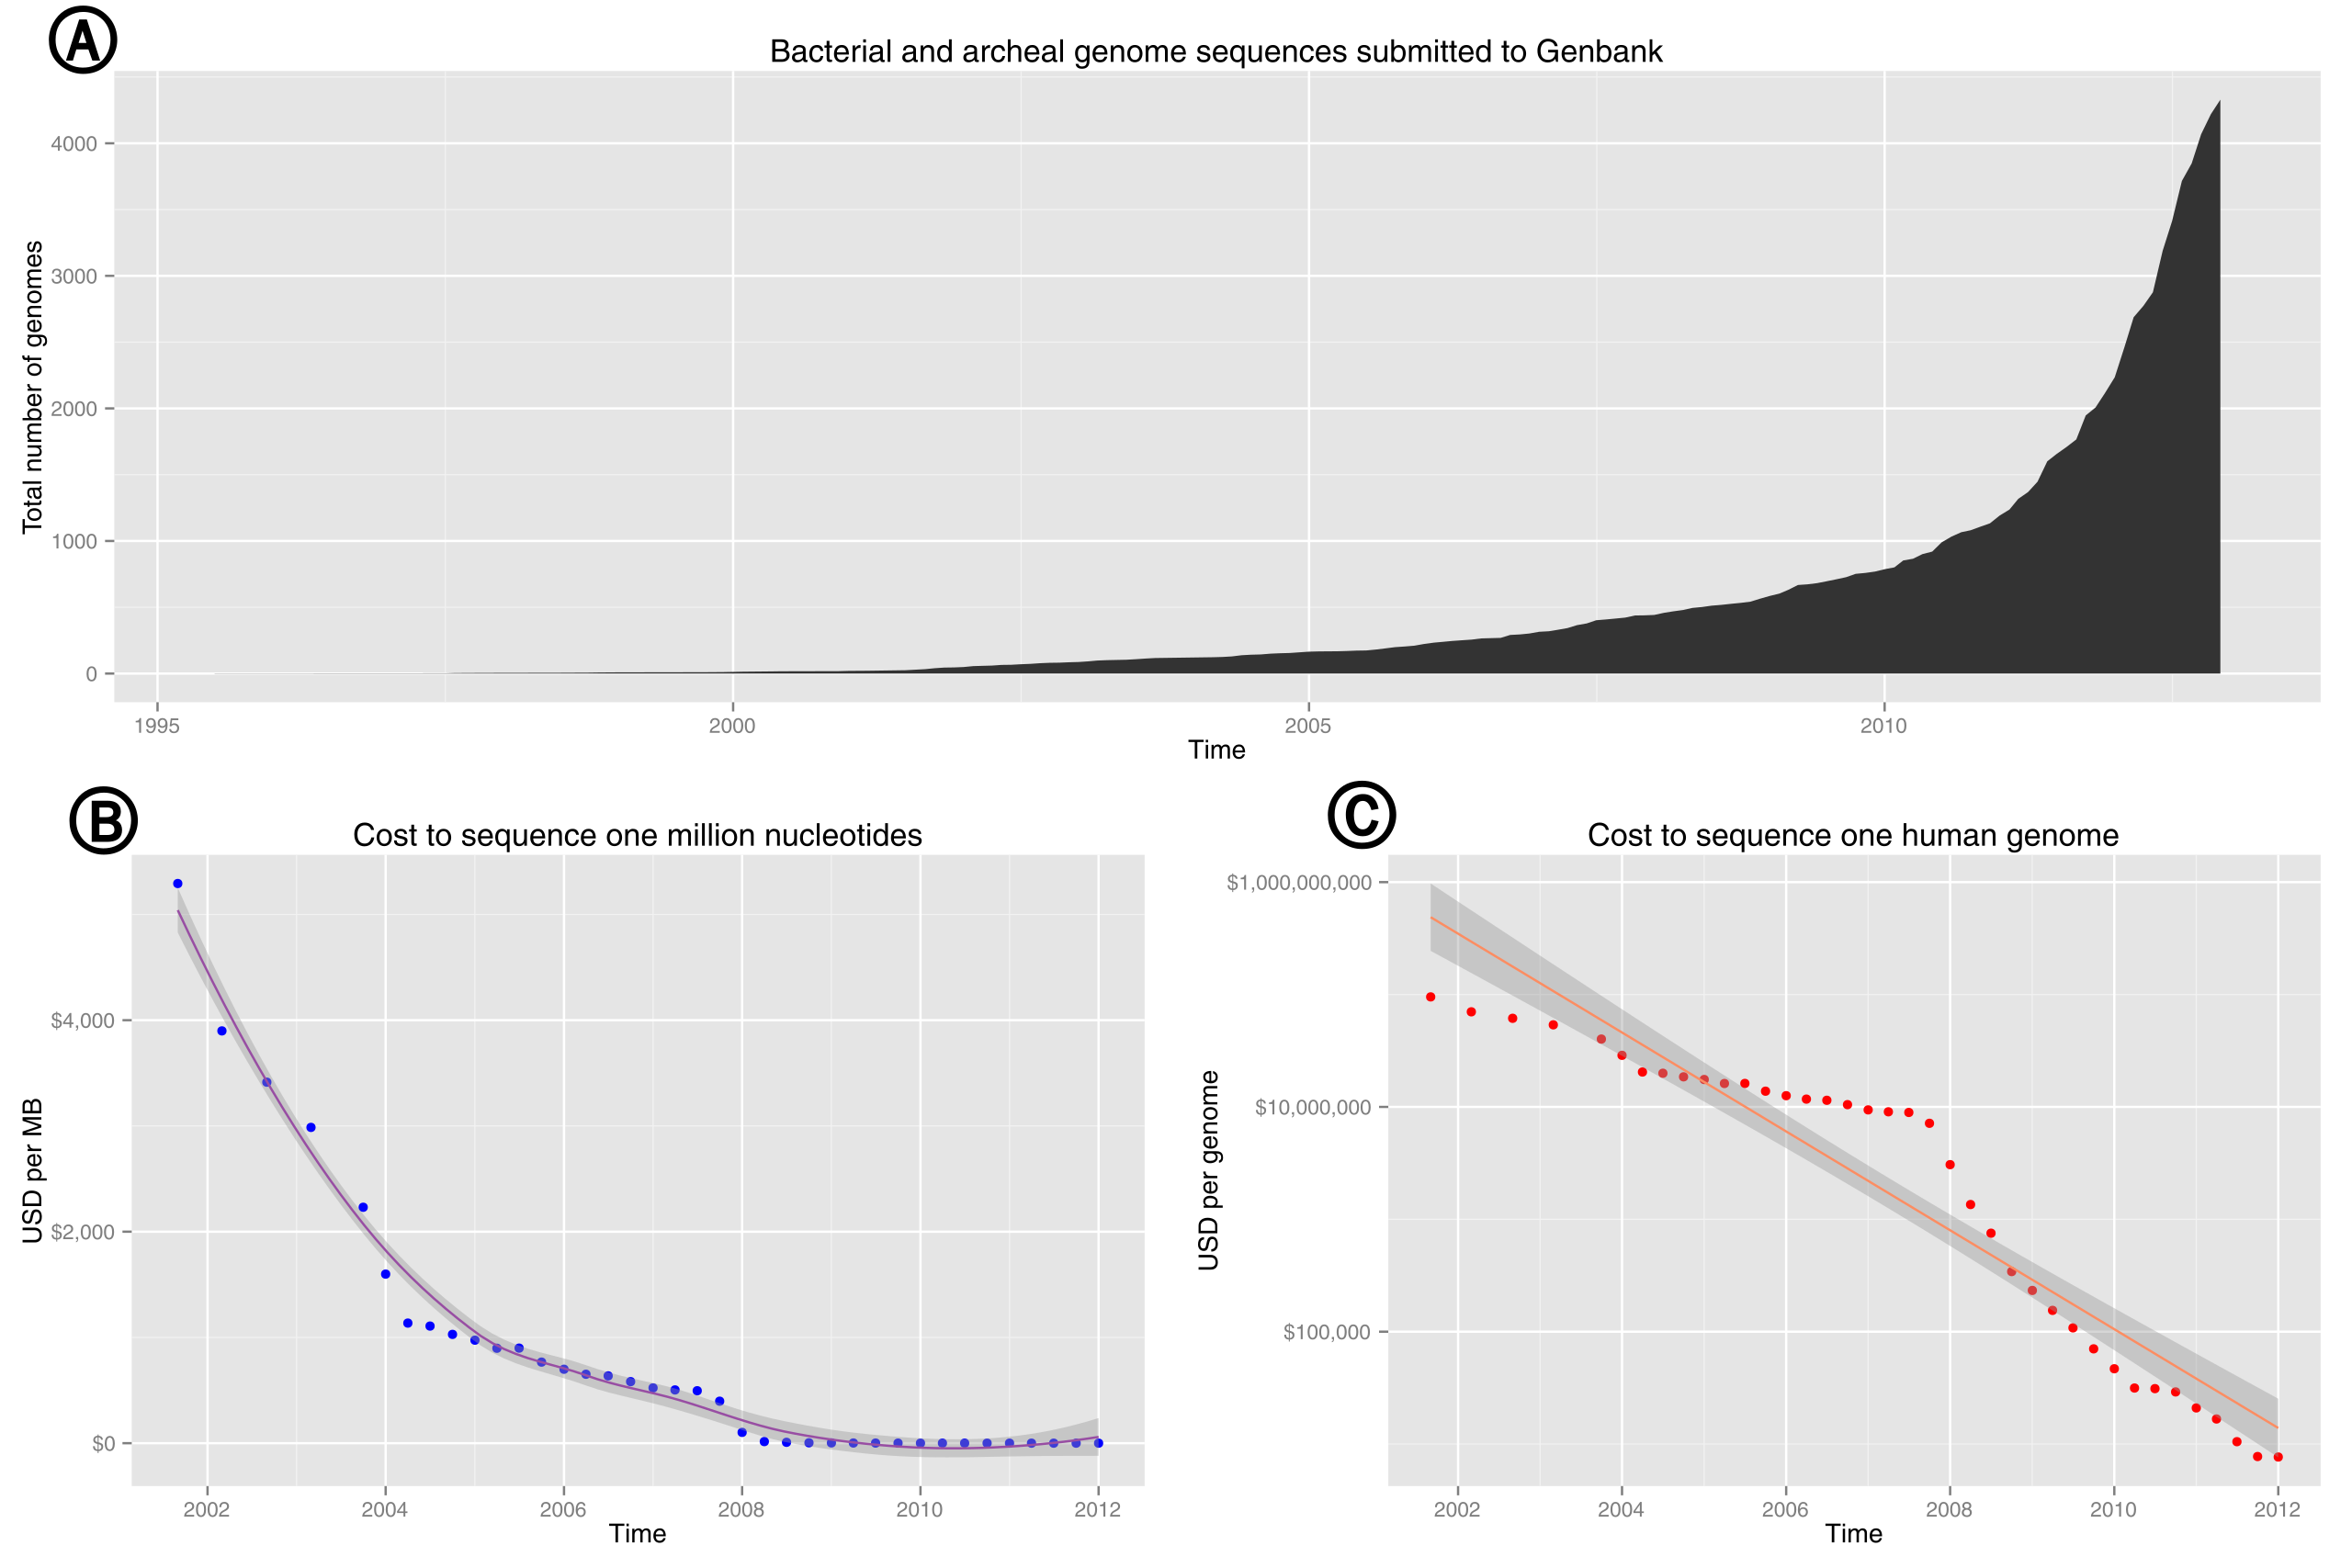
English: Plot of the total number of prokaryotic genomes submitted to Genbank as a function of time. Based on data from genome reports and genome.gov. Subfigures: (A) Exponential growth of genome sequence databases since 1995. (B) The cost in US Dollars (USD) to sequence one million bases. (C) The cost in USD to sequence a 3,000 Mb (human-sized) genome on a log10 transformed scale. |
| Datum | |
| Izvor | Vlastito djelo |
| Autor | Estevezj |
| Ostale verzije |
This file was derived from: Bacterial and archeal genome sequences submitted to Genbank.svg: |
| SVG genesis | |
| Izvorni kod | R code# Download our tables from NCBI's FTP site. Accessed 14:30PST, 18 December 2012
prok <- read.table("ftp://ftp.ncbi.nlm.nih.gov/genomes/GENOME_REPORTS/prokaryotes.txt", sep="\t", comment.char="!", header=T)
# Pull release dates, while dropping rows lacking a release date.
prok <- as.Date(prok$Release.Date[prok$Release.Date != '-'],format="%Y/%m/%d")
# Bin our dates by month and year, tabulate, and save to a dataframe.
prok.cut <- as.data.frame(
table(
as.Date(
cut(prok, "month")
)
)
)
# Correct our column titles, calculate a running total, and reconvert from factor to date
colnames(prok.cut) <- c("Date", "Total")
prok.cut$Total <- cumsum(prok.cut$Total)
prok.cut$Date <- as.Date(prok.cut$Date)
# DNA Sequencing Costs from NHGRI: http://www.genome.gov/sequencingcosts/
# Data from http://www.genome.gov/pages/der/sequencing_cost.pptx
# After munging the pptx, download the tables from pastebin. Accessed 12:42PST, 2012-12-20
seq.cost <- read.table("http://pastebin.com/raw.php?i=NA6c4i70", header=TRUE)
# Format the date.
seq.cost$Date <- as.Date(seq.cost$Date,format="%m-%d-%Y")
# Draw our plots
library("ggplot2")
library("grid")
library("scales")
(p <- ggplot(prok.cut, aes(Date, Total)) + geom_area() + ggtitle("Bacterial and archeal genome sequences submitted to Genbank") + xlab('Time') + ylab("Total number of genomes")
)
(mb <- ggplot(seq.cost, aes(Date, USD.per.Mb)) + geom_point(colour = "blue") +
stat_smooth(color="#984EA3")+
ggtitle("Cost to sequence one million nucleotides") +
xlab('Time') +
ylab("USD per MB") +
scale_y_continuous(labels = dollar)
)
(genome <- ggplot(seq.cost, aes(Date, USD.per.Genome)) + geom_point(colour = "red") +
stat_smooth(method='lm',color="#FC8D62")+
ggtitle("Cost to sequence one human genome") +
xlab('Time') +
ylab("USD per genome") +
scale_y_log10(labels = dollar)
)
# This part is based on Hadley's Ggplot2 book (doi:10.1007/978-0-387-98141-3_8)
# Save our plot to SVG
library(grDevices)
svg(filename='ncbi-genomes.svg', width = 15, height = 10)
grid.newpage()
pushViewport(viewport(layout = grid.layout(2, 2)))
vplayout <- function(x, y)
viewport(layout.pos.row = x, layout.pos.col = y)
print(p, vp = vplayout(1, 1:2))
print(mb, vp = vplayout(2, 1))
print(genome, vp = vplayout(2, 2))
dev.off()
|
Licenciranje
Ja, vlasnik autorskog prava ovog djela, ovdje ga objavljujem pod sljedećim licencama:
Ova datoteka je licencirana pod Creative Commons Attribution-Share Alike 3.0 neportiranom licencom.
- Slobodni ste:
- da dijelite – da kopirate, distributirate i prenosite djelo
- da remiksate – da prilagodite djelo
- Pod sljedećim uslovima:
- pripisivanje – Morate pripisati odgovarajuće autorske zasluge, osigurati link ka licenci i naznačiti jesu li napravljene izmjene. To možete uraditi na bilo koji razumni način, ali ne tako da se sugerira da davalac licence odobrava Vas ili Vašu upotrebu njegovog djela.
- dijeli pod istim uslovima – Ako mijenjate, transformišete ili nadograđujete ovaj materijal, morate ga objaviti i distribuirati samo pod istom ili sličnom licencom poput ove.

|
Dozvoljeno je kopirati, distribuirati i/ili mijenjati ovaj članak pod uslovima navedenim u GNU licenci za slobodnu dokumentaciju, verzija 1.2 ili kasnijom verzijom izdatom od Free Software Foundation; bez nepromjenljivih dijelova, te bez sadržaja na naslovnoj i zadnjoj strani. Kopija licence se nalazi pod poglavljem GNU Free Documentation License. |
Možete odabrati licencu po vašem izboru.
Historija datoteke
Kliknite na datum/vrijeme da vidite verziju datoteke iz tog vremena.
| Datum/vrijeme | Smanjeni pregled | Dimenzije | Korisnik | Komentar | |
|---|---|---|---|---|---|
| trenutno | 07:04, 21 decembar 2012 | | 1.350 × 900 (145 KB) | Estevezj | Added subplot labels. |
| 06:50, 21 decembar 2012 |  | 1.350 × 900 (107 KB) | Estevezj | {{Information |Description ={{en|1=Plot of the total number of prokaryotic genomes submitted to Genbank as a function of time. Based on data from [http://www.ncbi.nlm.nih.gov/genome genome reports] and [http://www.genome.gov/sequencingcosts/ genome.... |
Upotreba datoteke
Sljedeća stranica koristi ovu datoteku:
Globalna upotreba datoteke
Sljedeći wikiji koriste ovu datoteku:
- Upotreba na en.wikipedia.org
- Upotreba na id.wikipedia.org
- Upotreba na mk.wikipedia.org
- Upotreba na sr.wikipedia.org